
Apothecary & retail · Retail & studios
Rose Marie Apothecary
A handmade soap and skincare brand with a loyal local following and almost no online sales. Now a store that does 20,000+ visits in a month and four times the orders.
Apothecary & retail · Retail & studios
A handmade soap and skincare brand with a loyal local following and almost no online sales. Now a store that does 20,000+ visits in a month and four times the orders.
Rose Marie Apothecary makes small-batch soap and skincare in Phoenix. People who found the shop loved it, and the owner was already shooting the kind of video that gets watched. What was missing was the machine behind it: the Shopify store was doing a handful of orders a month, and the content that was landing on social was not turning into traffic, let alone checkouts.
In the twelve months before the work started in earnest, the store averaged about a hundred visits a month. Orders came in ones and twos. The brand had an audience. It did not have a sales channel.
A loved local brand with a Shopify store almost nobody was reaching.
Orders up 475% year over year in Q3. 89% of all traffic from social.
The plan was to put the whole mix behind content that was already working. We took over the feed at five static posts and five reels a week, every week, and rebuilt the Shopify storefront so that when a video hit, the people who clicked through landed on a store that could take the order. Then we put paid dollars behind the posts that were already earning reach, so a good week on Instagram became a good week at the checkout.
Traffic moved first. The store went from a few hundred sessions a month in spring to 1,500 in June, 2,650 in July, and 20,106 in September — roughly 170 times the traffic of the same month a year earlier. Social became the number one source by a mile: 89% of every session in the last six months came from Facebook and Instagram, and paid social alone brought 22,600 new visitors to the store.
Orders followed. Before summer the store was averaging about seven orders a month. From July it averaged thirty-one. Third-quarter orders went from 16 in 2025 to 92 in 2026, a 475% increase, and quarterly revenue nearly tripled. The storefront held up as volume multiplied: conversion rate climbed to 1.6% in August and again in October, on far more visitors than the store had ever seen.
Five posts and five reels a week on Facebook and Instagram, every week.
Meta AdsPaid reach behind the content that was already landing — 22,900+ paid-social store visits.
Web designA Shopify storefront rebuilt to convert when the traffic arrived.
Every figure on this page is measured: Shopify analytics for sessions, orders, revenue and conversion rate; GA4 for traffic by channel. Year-over-year comparisons are Q3 2025 against Q3 2026.
A store that went from a handful of orders a month to a real e-commerce channel, with social as the engine and a storefront that converts.
A loved local brand, a Shopify store doing a handful of orders a month, video that got watched but did not get bought.
Five posts and five reels a week; the Shopify storefront rebuilt so a click from a video lands on a page that can take the order.
Meta Ads put behind the posts already earning reach. Traffic goes from hundreds a month to thousands; orders from seven a month to thirty-one.
The biggest month in the store’s history. Social is 89% of traffic and the storefront converts at 1.6%.
Results shown are specific to this client and are not typical. What any business gets back depends on its market, its budget, its pricing and how it handles the leads it receives. Nothing here is a guarantee or a projection of what your business will earn. Figures cover a defined period and we will walk through how each one was measured on the call.
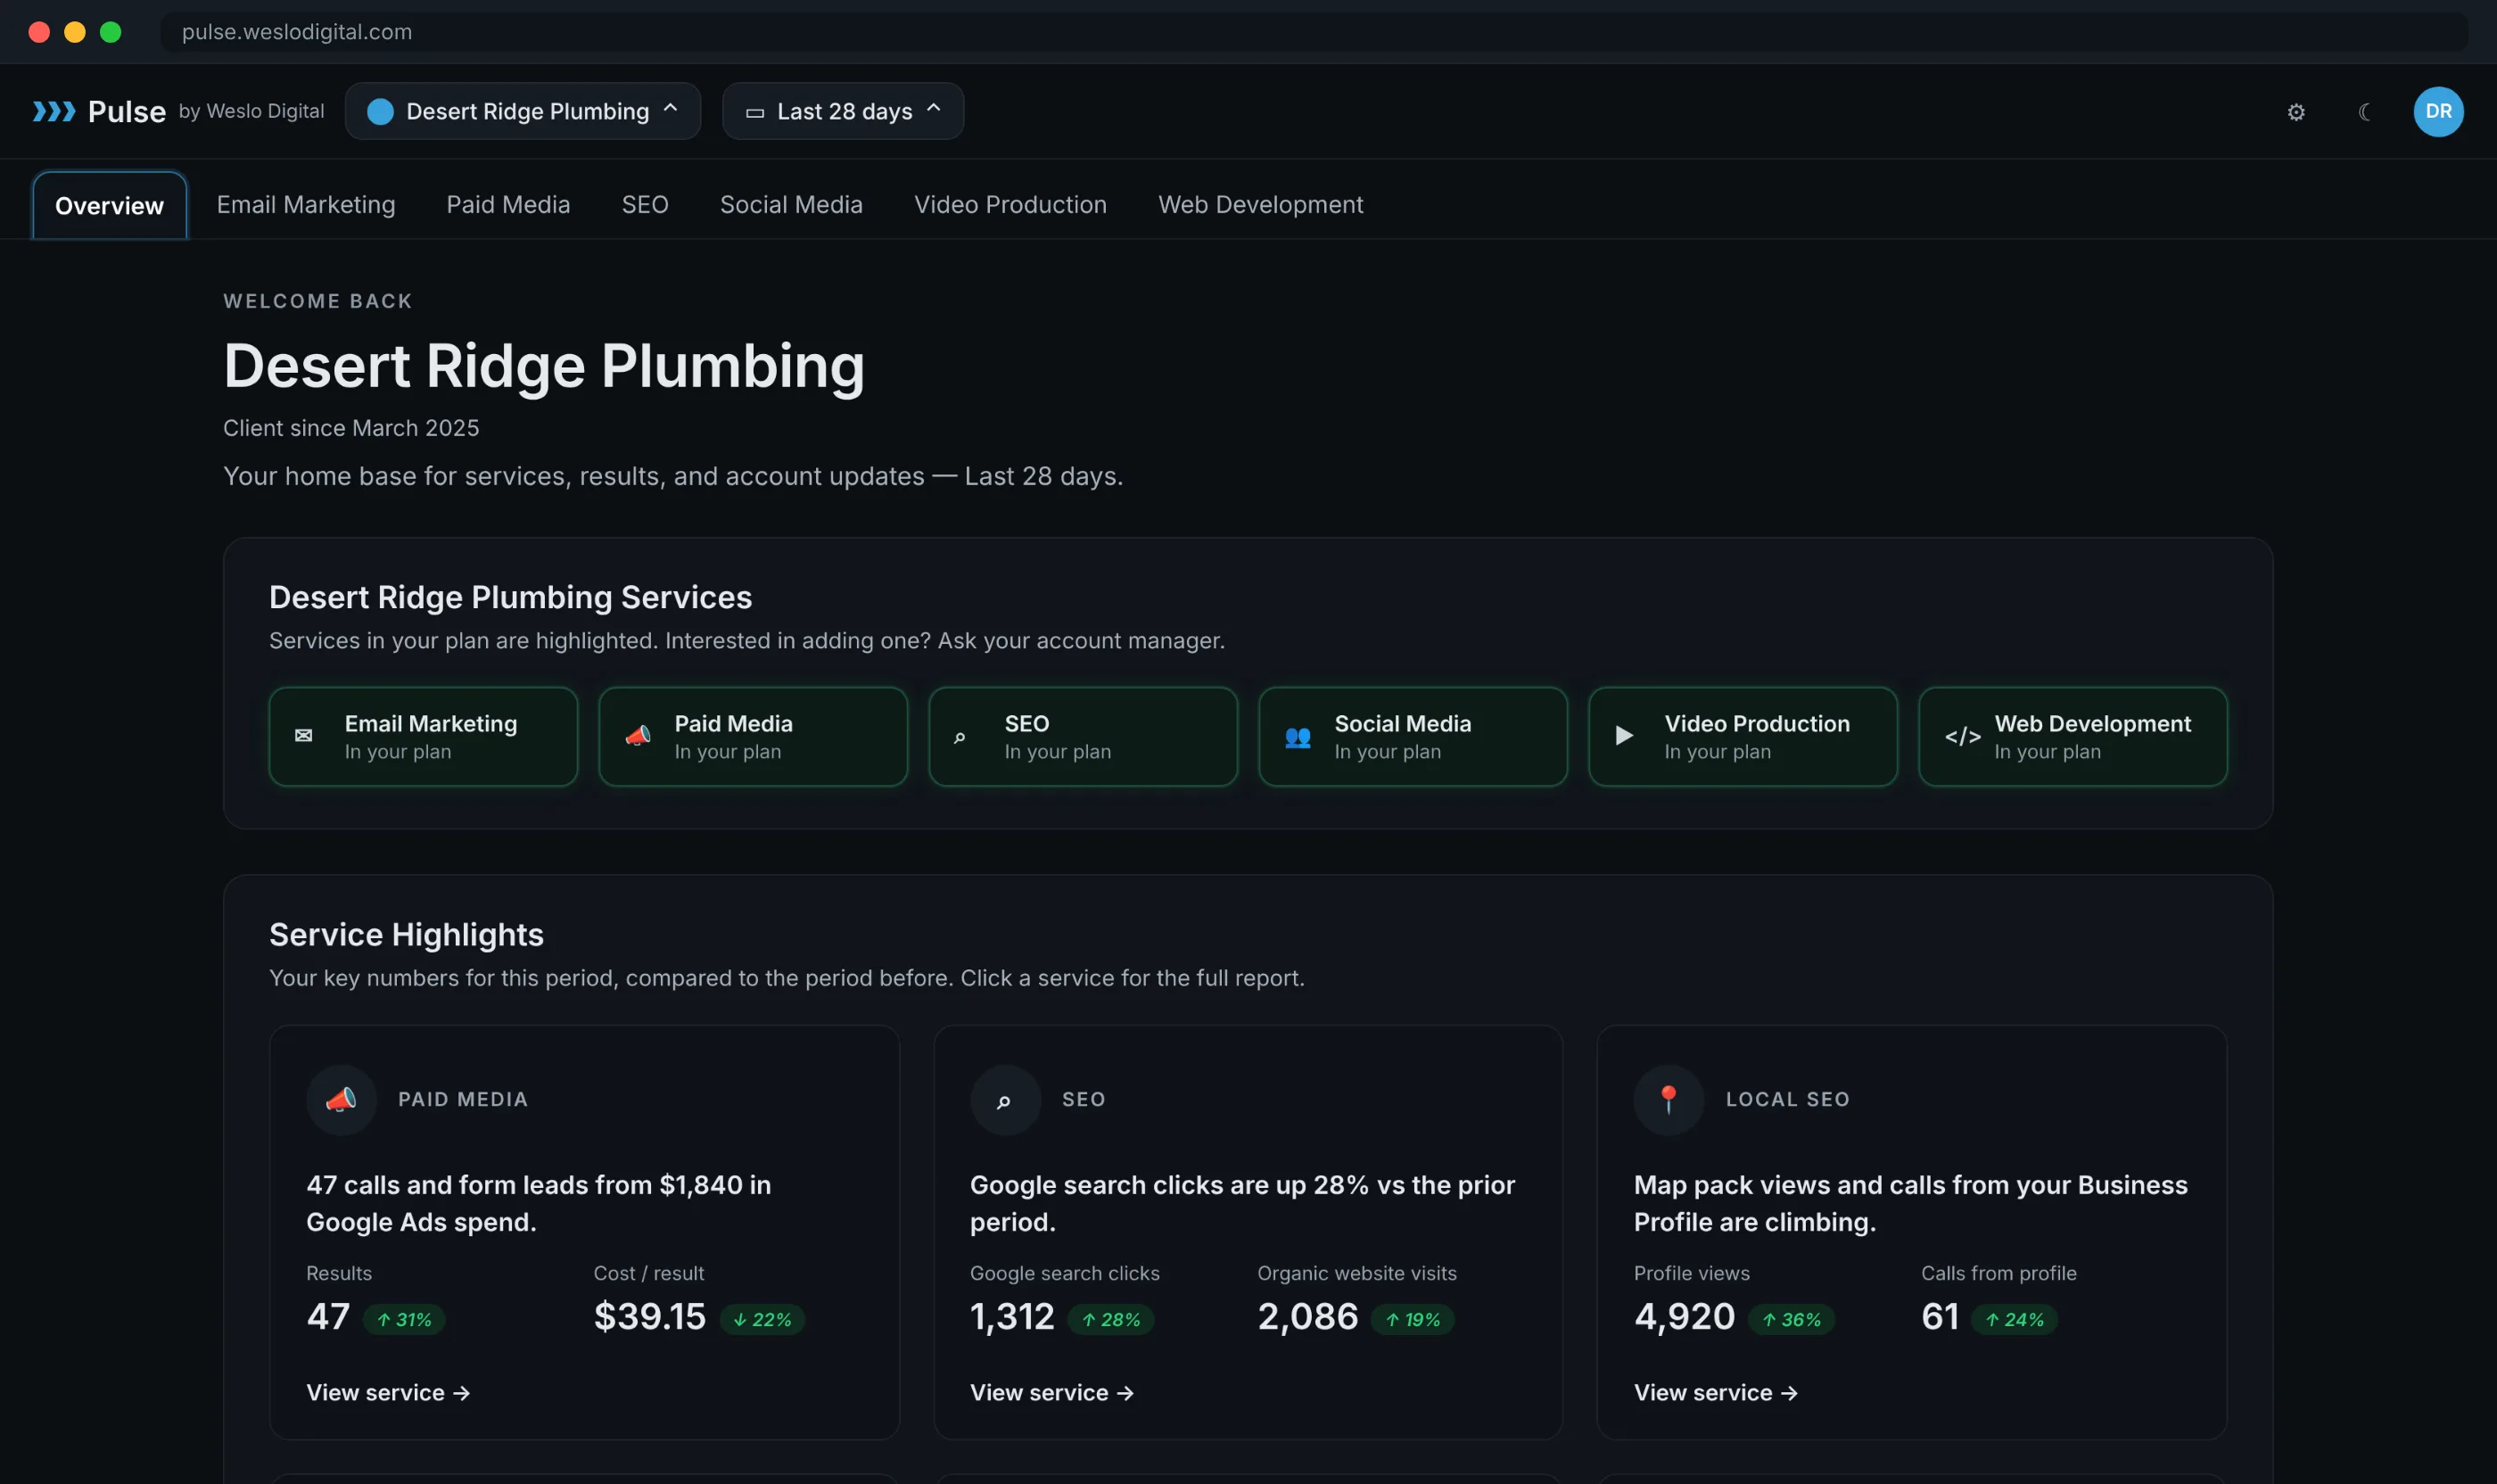
However much or little we run for an account, it reports to one place. No chasing numbers across platforms to find out whether the work is landing.
SEO, Local SEO, Google Ads, Meta, social, video and the website all feed Pulse — leads, calls, spend and traffic in one place, updating as it happens. It is how an account stays accountable instead of being described to you once a month.
Every account we run gets one, with a login of their own. No monthly PDF, no waiting on a report — the numbers are there whenever they want to look.
20-Minute Marketing Audit
We open your accounts on a screen share, show you the spend that isn't producing work, and tell you what we'd change first. No deck, no pitch, and the findings are yours either way.
19820 N 7th St, Ste 230, Phoenix, AZ 85024
(602) 614-5169 · weslodigital@gmail.com